ကျွန်ုပ်တို့၏ ဝန်ဆောင်မှုစည်းမျဉ်းများ နှင့် ကိုယ်ရေးအချက်အလက်လုံခြုံမှုဆိုင်ရာ မူဝါဒ ကို အပ်ဒိတ်လုပ်ထားသည်။ ရှေ့ဆက်ခြင်းဖြင့် သင်သည် Tenor ၏ ဝန်ဆောင်မှုစည်းမျဉ်းများ နှင့် ကိုယ်ရေးအချက်အလက်လုံခြုံမှုဆိုင်ရာ မူဝါဒ ကို သဘောတူပါသည်။
သင့်ဘရောင်ဇာ၏ ဘာသာစကားဆက်တင်ပေါ် အခြေခံပြီး Tenor.com ကို ဘာသာပြန်သည်။ ဘာသာစကားပြောင်းလိုပါက နှိပ်ပါ။
Tenor လိုဂို
အပ်လုဒ် သင်္ကေတပြုလုပ်ရန်
ထုတ်ကုန်များ
  • GIF ကီးဘုတ်
  • Android
စူးစမ်းလေ့လာရန်
  • တုံ့ပြန်ချက် GIF များ
  • GIF များ ရှာရန်
ကုမ္ပဏီ
  • မေးလေ့ရှိသော မေးခွန်းများ
  • စည်းမျဉ်းနှင့် ကိုယ်ရေးအချက်အလက်လုံခြုံမှု
  • ဝဘ်ဆိုက်လိုင်စင်များ
  • ကျွန်ုပ်တို့ကို ဆက်သွယ်ရန်
ပါတနာများ
  • အကြောင်းအရာပါတနာများ
  • Tenor GIF API
Tenor လိုဂို

Graph Algorithms

အားလုံးGIF များစတစ်ကာများMeme ရုပ်ပြောင်များ
a diagram of a shortest path between nodes a and g is shown
  • #dijkstra
  • #algorithm
  • #dsa
  • #leetcode
a white cat with a caption that says when you handle negative edge weights by using bellman ford instead of dijkstra
  • #bellman-ford
  • #dijkstra
  • #cs
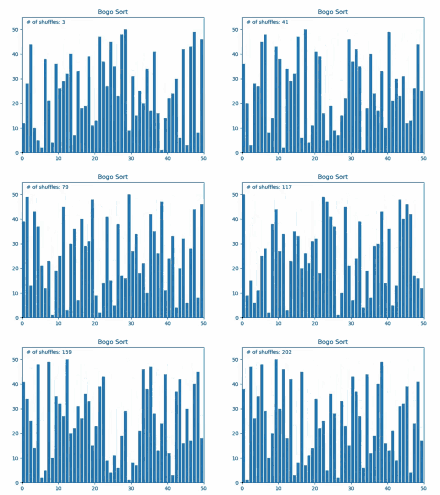
a bar graph showing the number of shuffles in a bogo sort
  • #Sort
  • #chart
  • #Linear-Representation
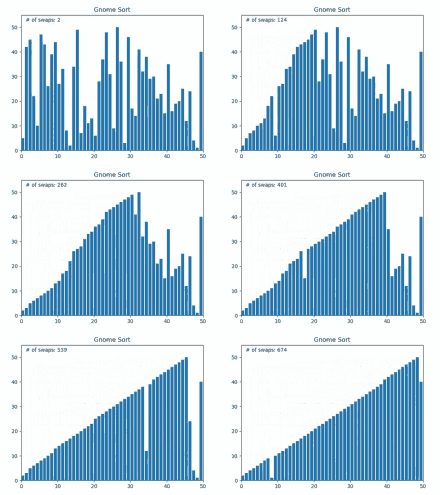
a graph showing the number of swaps between gnomes
  • #Sort
  • #graph
  • #Gnome-Sort
  • #chart
a graph with a line going up and down on a yellow background
  • #gofourward
  • #webdesign
  • #design
  • #graph
a yellow graph with a line going up
  • #Gofourward
  • #webdesign
  • #desgin
  • #graph
a 3d graph of a colorful star with the numbers 1 through 5 on it
  • #math
  • #graph
  • #3d
  • #algebra

ဤနေရာတွင် နှိပ်ပါ

Tenor သို့ အပ်လုဒ်လုပ်ရန်

ကိုယ်ပိုင် GIF များ အပ်လုဒ်လုပ်ရန်

    a cartoon drawing of a painting on an easel with the words art opportunity above it
    • #Art
    • #artist
    • #artistic
    • #Art-Education
    a picture of a soap dish with the words " data driven decisions " above it
    • #data-driven-decisions
    a cartoon of a man holding up a box with graphs and gears on it
    • #gears
    • #graph
    • #Thumbs-Up
    a graph of a mathematical function with a red line going through the middle .
    • #questao3lista3vib
    • #graph
    a computer generated image of a stock chart with the number 0.362 at the top left
    • #krypto
    • #strejdobrazy
    • #crypto
    • #graf
    a black background with the words graph and community
    • #Graph
    a black and white photo of an earthquake with the words `` the sassmograph is going crazy ! ''
    • #sassy
    • #graph
    • #sass
    an illustration of a bar graph showing a few different colors
    • #graph
    a graph showing the number of children born in the united states
    • #graph
    • #increase
    • #Record
    a computer generated image of a parabola with a red point
    • #mathematics
    • #graph
    • #parabola
    the letter c is purple and has a shadow on it .
    • #Graph-Communyti
    a 3d graph with the word sim on the bottom left
    • #sim
    • #graph
    • #data
    a black background with purple text that says graph-community .
    • #graph
    a pink circle with a white circle and a white arrow
    • #Zoner-GRT
    • #GRT
    • #The-Graph
    a close up of a tism gauge with a red arrow pointing to it
    • #alert
    • #peak
    • #tism
    • #graph
    a picture of a girl with a caption that says when you find a shorter path in dijkstra
    • #dijkstras
    • #dijkstra
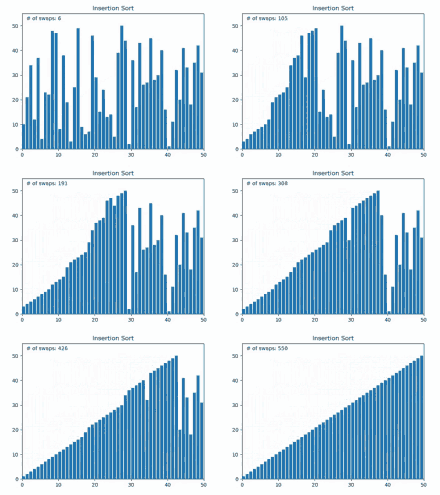
    a graph showing the number of swaps in a row
    • #Sort
    • #graph
    • #Insertion-Sort
    • #chart
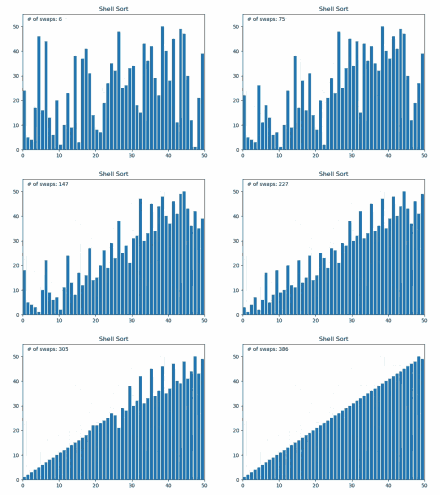
    a line graph showing the number of swaps in a shell sort
    • #Sort
    • #graph
    • #Shell-Sort
    • #chart
    a selection sort graph shows a number of swaps of 3
    • #Sort
    • #graph
    • #Selection-Sort
    • #chart
    a graph showing a blue line with red stars on it and the number 12 at the top
    • #gradientdescent
    • #Graph
    • #Lines
    • #Wave
    a graph shows the aboriginal population in canada from 1971 to 2001
    • #graph
    a screenshot of acoustic prediction tool showing a frequency plot
    • #graph
    a black background with purple text that says graph community
    • #Graph
    a graph showing a blue circle and a red circle on a grid
    • #epicyclodial
    • #math
    • #graph
    a graph showing the number of people in each month and a line graph showing the number of people in each month
    • #stats
    • #graph
    • #improving
    a graph showing a larger count vs. returned units
    • #Gerry-Mander
    • #Gerry-Mandering
    Graph GIF
    • #graph
    a graph showing a red line going down
    • #line-graph
    a graph of the population of australian capital cities
    • #graph
    • #population
    a black background with purple text that says graph-community ii
    • #Graph-Communyti
    a dark background with purple text that says graph-community
    • #Graph-Communyti
    the words graph and community are glowing in the dark
    • #Graph
    a black and white image of a table that says table ( read.csv )
    • #graph
    a dashboard shows a number of posts and comments
    • #Data-Analisis
    • #data
    • #graph
    a table showing the percentages of samsung huawei and xiaomi phones
    • #Andelar
    • #graph
    • #sales
    a dashboard for hr companion shows the number of positive cases and negative cases
    • #Zforce-Cfc2020
    • #Stats
    • #Graph
    a pie chart shows a percentage of people using elearning
    • #graph
    • #spin
    • #Elearning
    a 3d graph of a circle with a blue line going through it
    • #graph
    • #data
    • #sssspppp
    a computer screen displays a financial graph with the number 1100.00 at the top
    • #graph
    a picture of a bison and a basketball with the word ndsu on it
    • #webdesign
    • #graph
    • #linegraph
    • #design
    a black background with a few lines that say ' lx cost increase '
    • #cache
    • #lines
    • #graph
    • #data
    a computer generated image of a grid that looks like a kaleidoscope
    • #abstract
    • #lines
    • #graph